PPTlover · financial presentation maker
Financial presentation maker where every number earns its place.
Turn results, research and portfolio data into slides that read at a glance: performance charts, KPI tiles, bridges and tables designed for banking, asset management, accounting and research.
العربيةReal slides, made with PPTlover.
Examples in Data & finance, Consulting styles, each made from a short fictional brief.
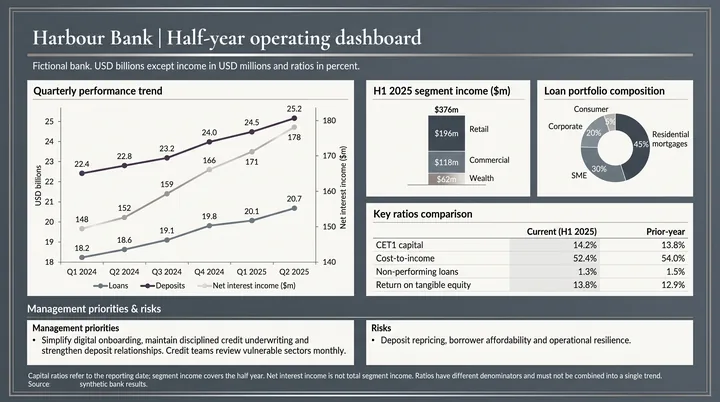
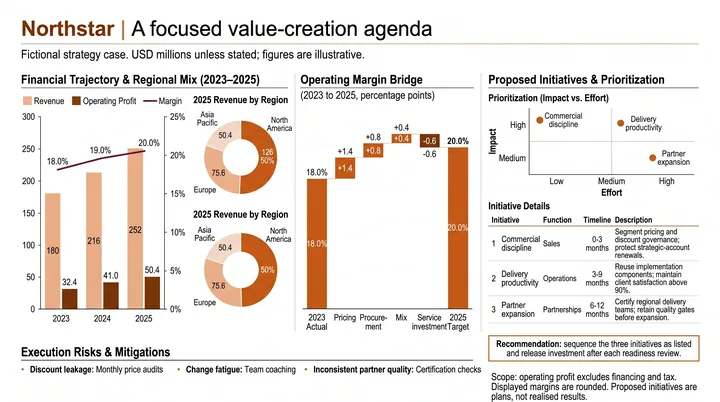
Why people choose PPTlover as their financial presentation maker.
Charts built for finance
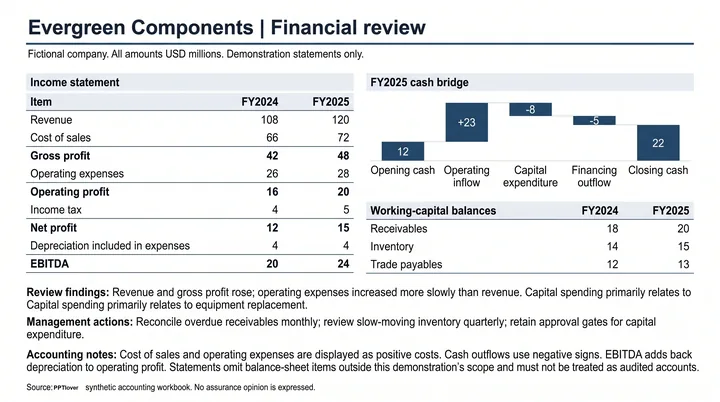
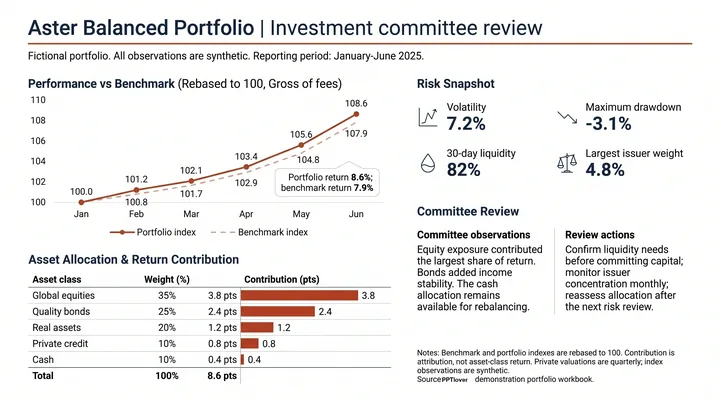
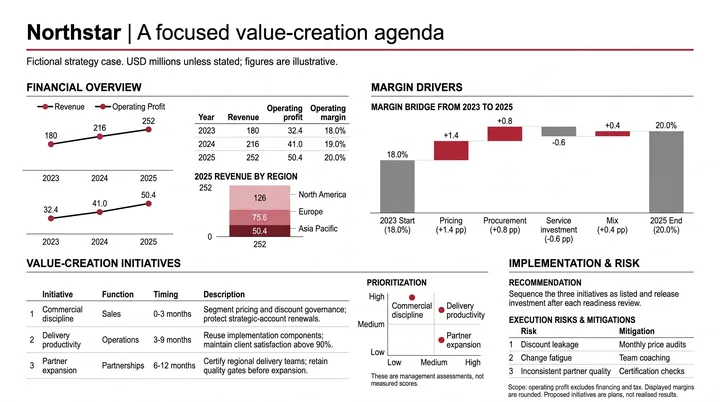
Revenue bridges, performance against benchmark, allocation and risk views.
KPI dashboards
Headline figures with context, growth markers and clear labels.
Tables that stay accurate
Keep your source tables exactly as written, or let PPTlover redesign them for the slide.
Board ready
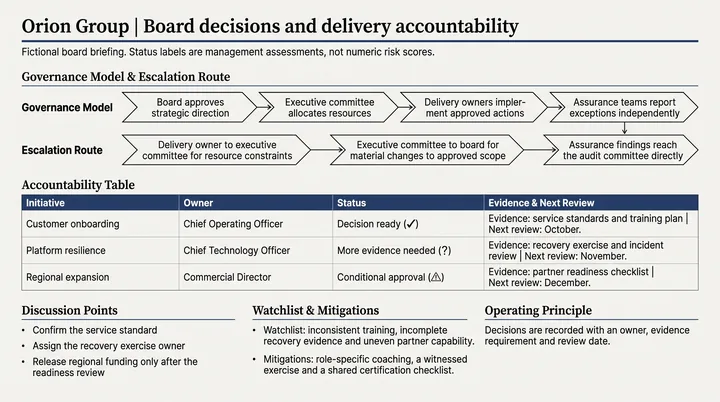
Restrained styles for board packs, investor updates and audit committees.
Three steps to a finished deck.
- 01
Bring your content
Upload a PDF, Word file, text, images or a web link, or write a short brief.
- 02
Pick your style
Choose one of 76 styles and a colourway, in 2K or Ultra sharp 4K.
- 03
Download and present
Get PowerPoint (.pptx), PDF or images. Choose editable text to change words later.
Questions about the financial presentation maker.
Can I bring my numbers from Excel?
Paste your figures into the brief or upload a document that contains them, and PPTlover charts them.
Will my tables be changed?
Only if you want them to be. Choose to keep tables from your source and they are presented as written.
Which styles fit finance?
Capital Markets, Financial Report, Banker Slate, Ledger Trust and other data styles.
Start with one slide. It is free.
No card needed. Pro is $20 a month for 600 credits when you want more.
Start creating